Every feature is designed to give you a decisive edge — whether you're a retail investor or managing a fund.
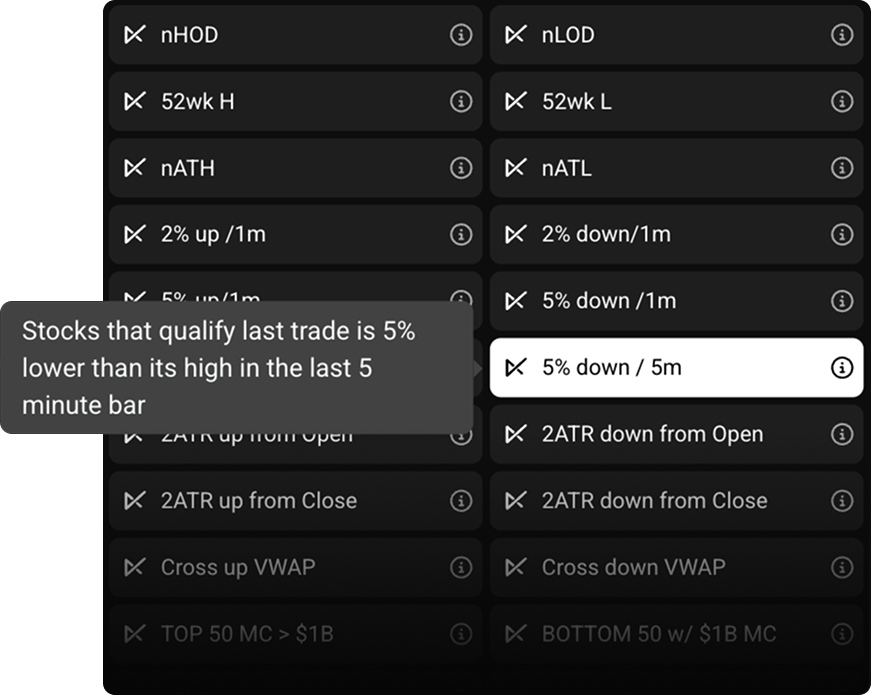
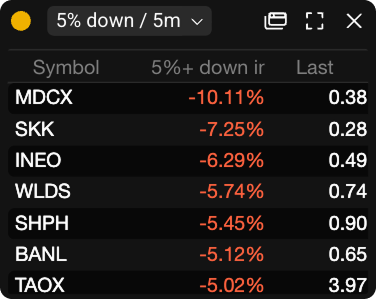
Stop searching, start finding. Alpha Scans are expertly crafted market filters that surface stocks meeting specific conditions — momentum breakouts, oversold reversals, insider buying, and more — all updated in real-time so you're always looking at today's market, not yesterday's.
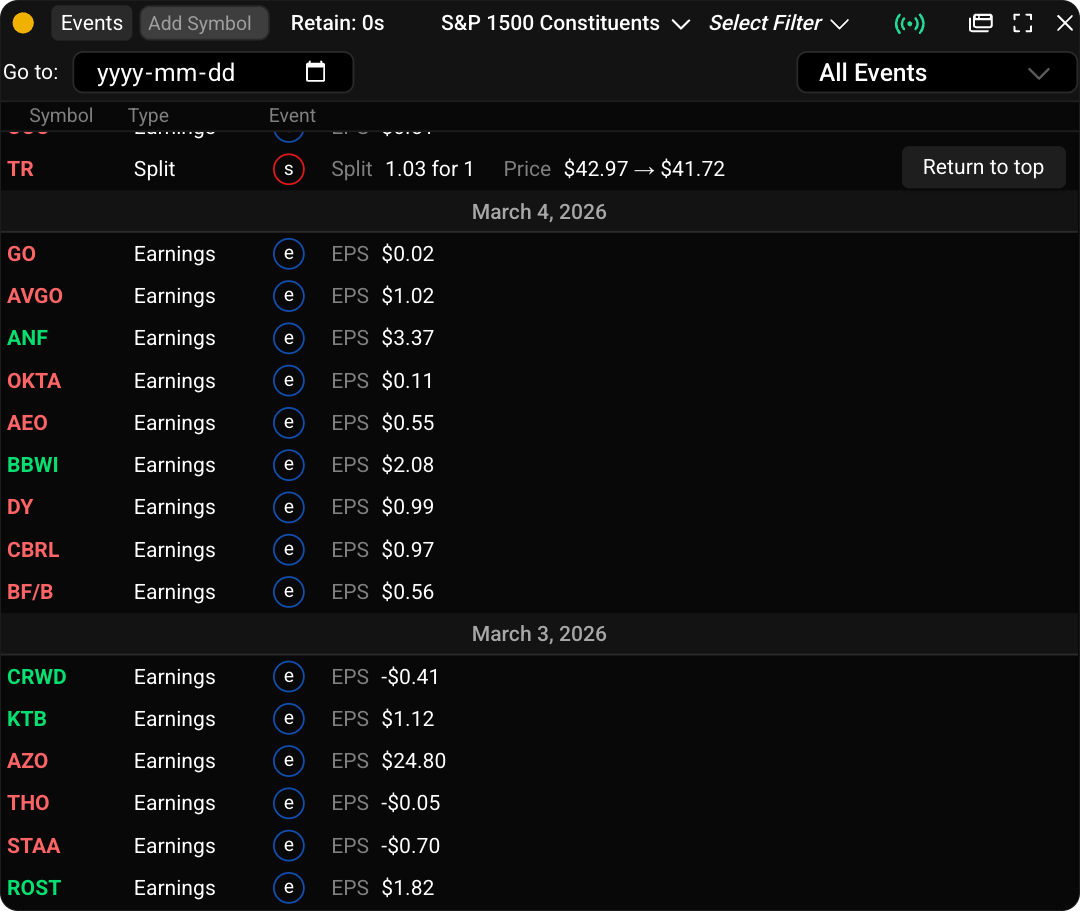
Never miss a market-moving event. Track earnings reports, dividend announcements, SEC filings, and corporate actions in one unified calendar — all filterable by your watchlist.
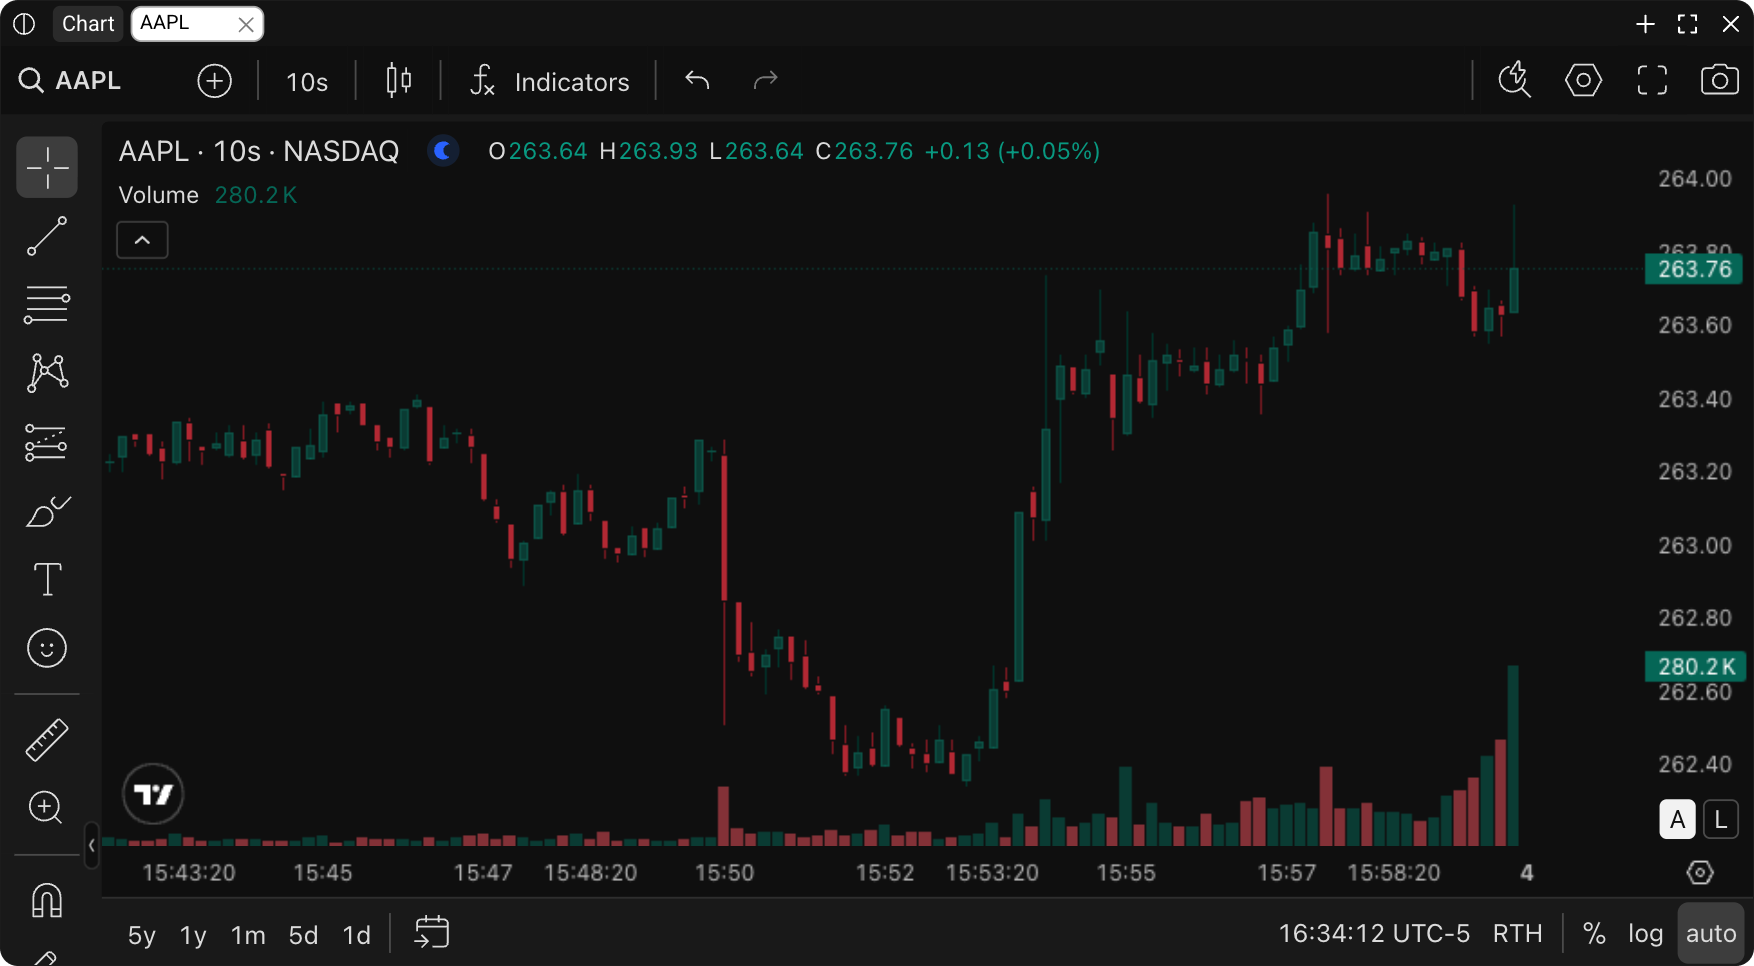
Analyze any instrument with professional-grade interactive charts powered by TradingView — the most trusted charting library in finance. Full candlestick, line, and area chart types with a complete suite of drawing tools and overlays.
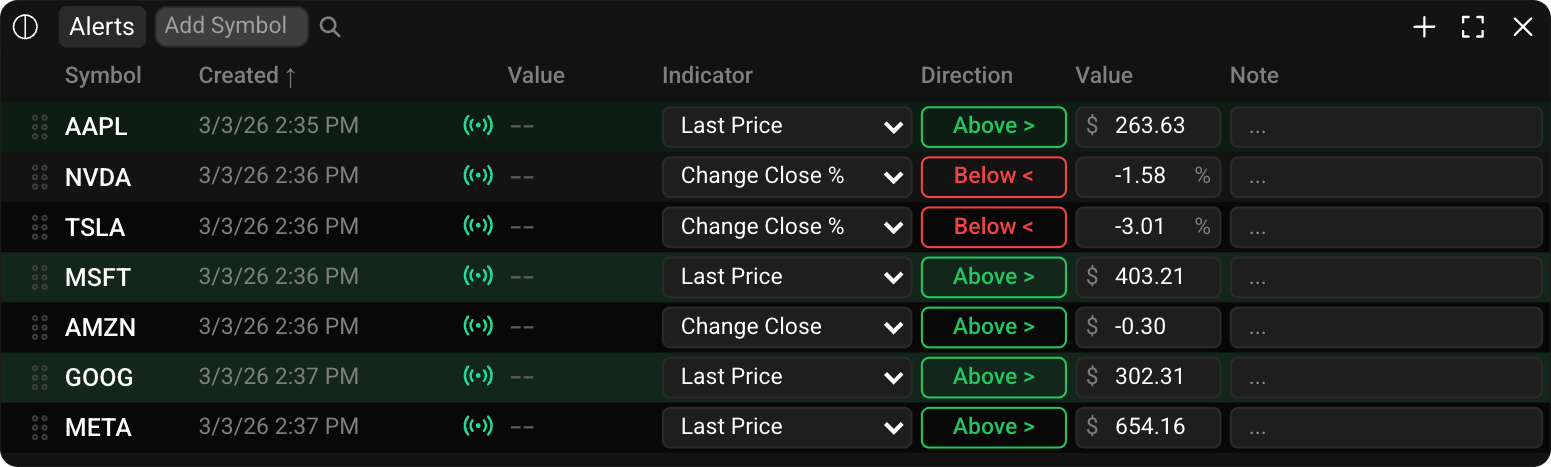
Set custom price and indicator alerts so you never miss a trade. Get notified instantly when your conditions trigger — via email, push notification, or in-app alert.
Build your perfect workspace with our drag-and-drop grid layout. Arrange charts, watchlists, scanners, and news widgets into a clean, aligned layout — optimizing every pixel of screen real estate without overlapping.
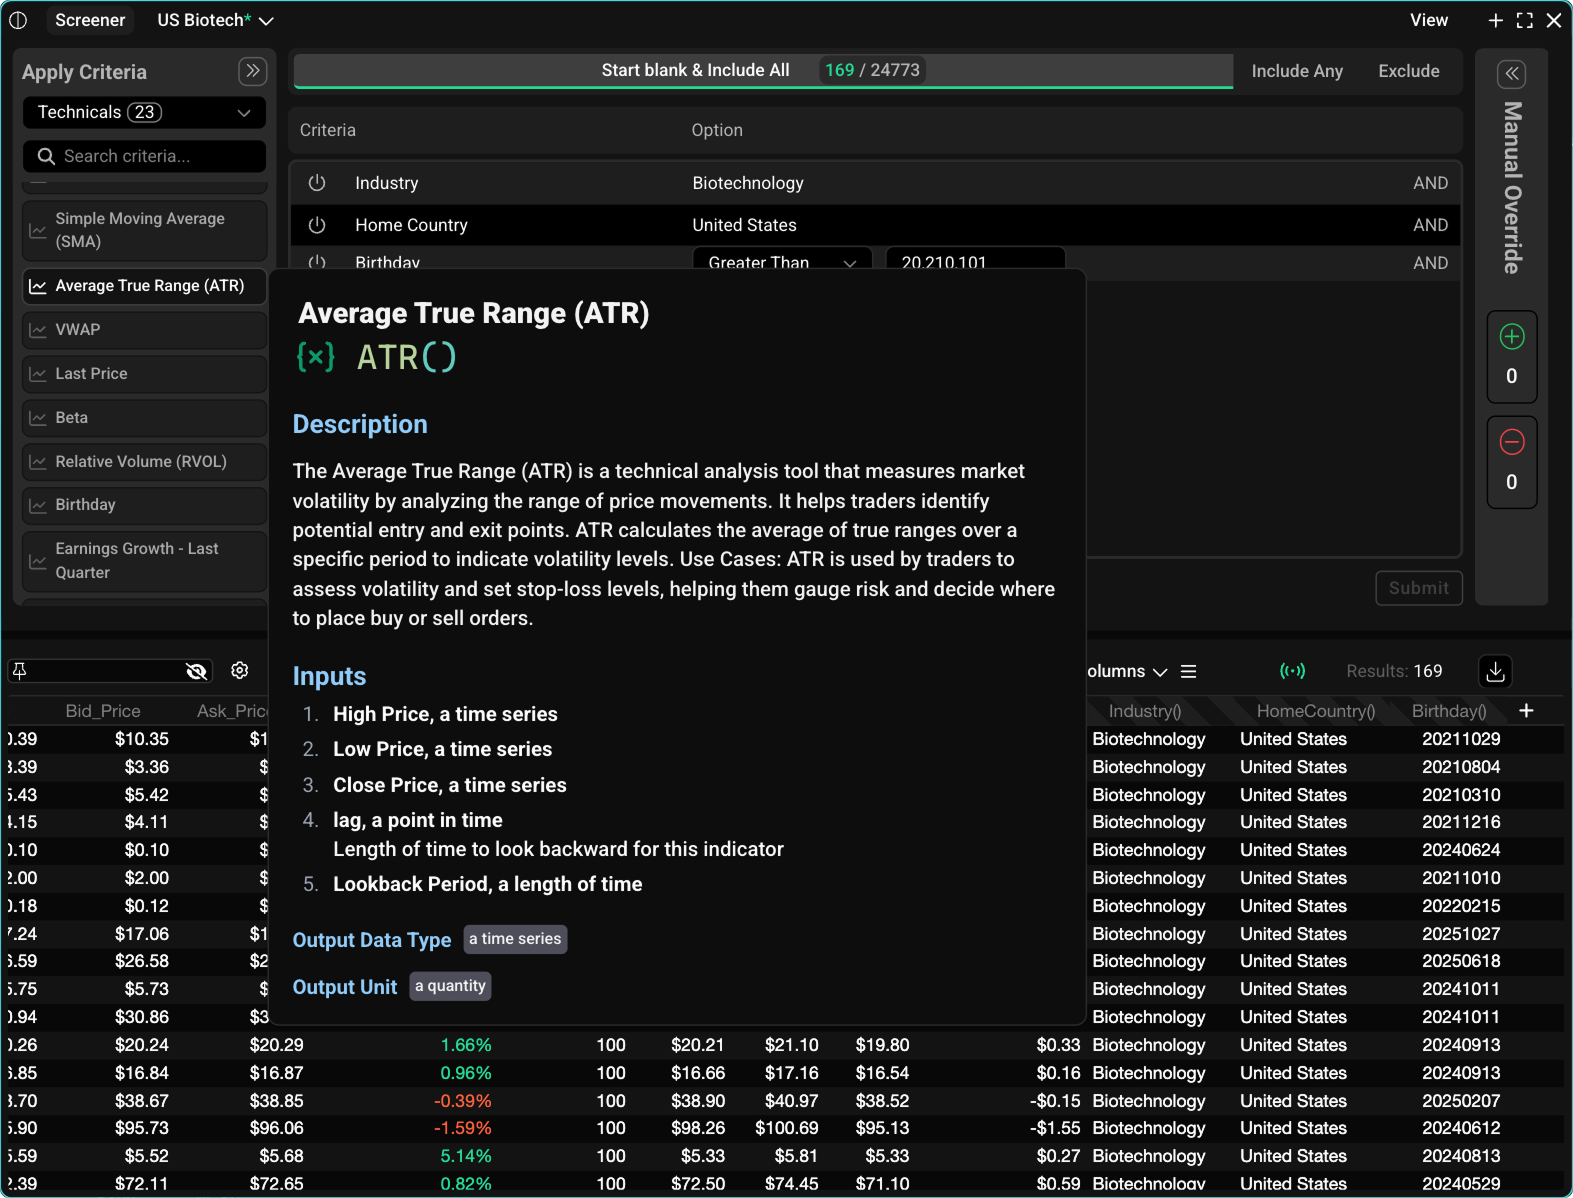
Build powerful screens using natural language or our formula syntax. Filter the entire US equity universe by any combination of technical indicators, fundamental metrics, and custom criteria — in real time.
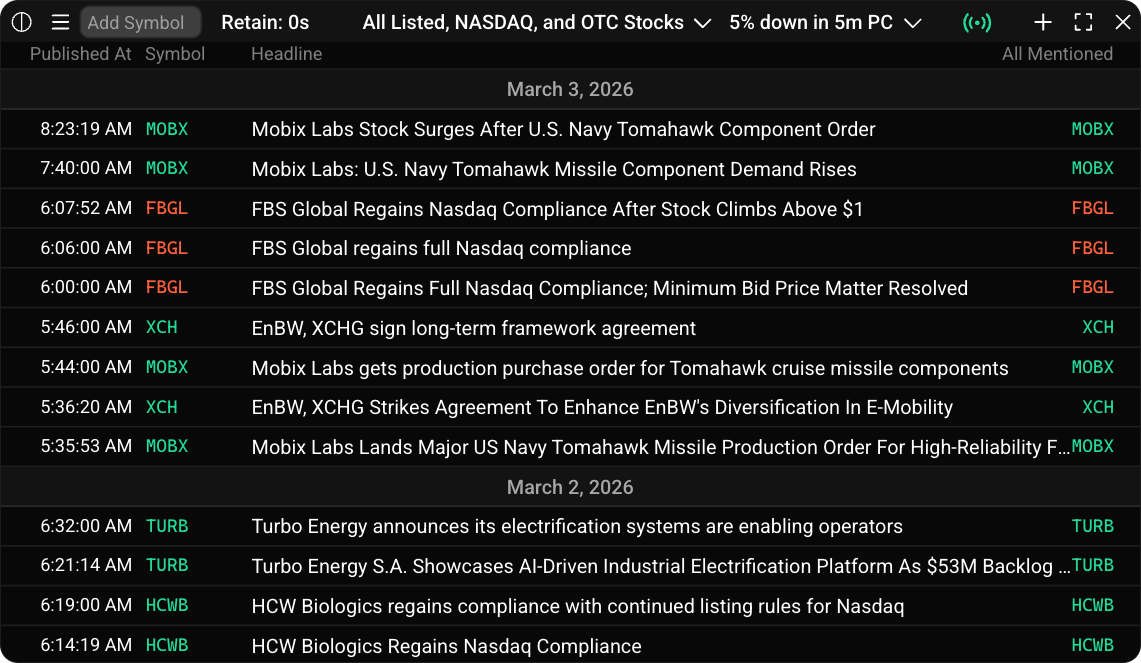
Stay ahead of the market with an aggregated feed of financial news from major sources — filterable by your watchlist, sectors, or custom keywords. AI-powered summaries help you cut through the noise.
Search the market like you search the web. AlphaLens uses deep learning and AI to translate natural language into sophisticated analytical queries — no coding, no formula memorization, no learning curve.
| You Type | AlphaLens Generates |
|---|---|
| “bar close is greater than 5” | BarClose(1d) > 5 |
| “highly correlated with Apple” | CORREL(BarClose(1d),BarClose(1d)."AAPL",[90d:0]) > 0.8 |
| “20 day ADV over 500K” | AVG(BarVolume(1d),[20d:0]) > 500000 |
ABS(CORREL(BarClose(1d)."GOOG",[90d:0])) < 0.2
AND AVG(BarVolume(1d),[20d:0]) > 1000000
Validate any trading strategy before putting real capital at risk. Define entry and exit rules, position sizing, and risk constraints — then let AlphaLens run the simulation.
| Feature | Essential $19.99/mo |
Plus $49.99/mo |
Elite Coming Soon |
|---|---|---|---|
| Events & Earnings Calendar | ✓ | ✓ | ✓ |
| Advanced Charting (TradingView) | ✓ | ✓ | ✓ |
| Price Alerts | ✓ 25 symbols | ✓ 200 symbols | ✓ Unlimited |
| Grid Layout Builder | ✓ | ✓ | ✓ |
| Stock Screener | — | ✓ | ✓ |
| Market Scanner | — | ✓ | ✓ |
| Financial News Feed | — | ✓ | ✓ |
| NLP Query Engine | — | — | ✓ |
| Strategy Backtesting Coming Soon | — | — | ✓ |
| API Access Coming Soon | — | — | ✓ |
| Free Trial | 1 week | — | — |
| Dedicated Support | Priority | Dedicated Rep |
Start your 14-day free trial and experience every feature risk-free. No credit card required.
